
We’ve launched a podcast! Listen to the latest episode.

Who is ADDRI?
ADDRI is an independent, not-for-profit research institute committed to reducing and ultimately eliminating the impact of asbestos and dust-related diseases worldwide.
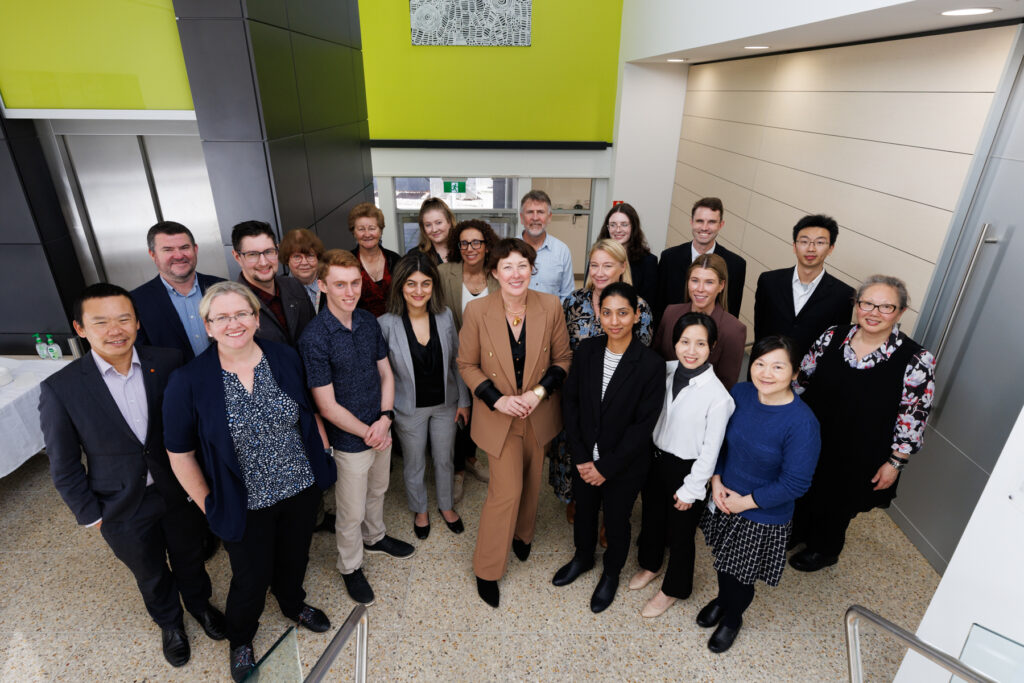
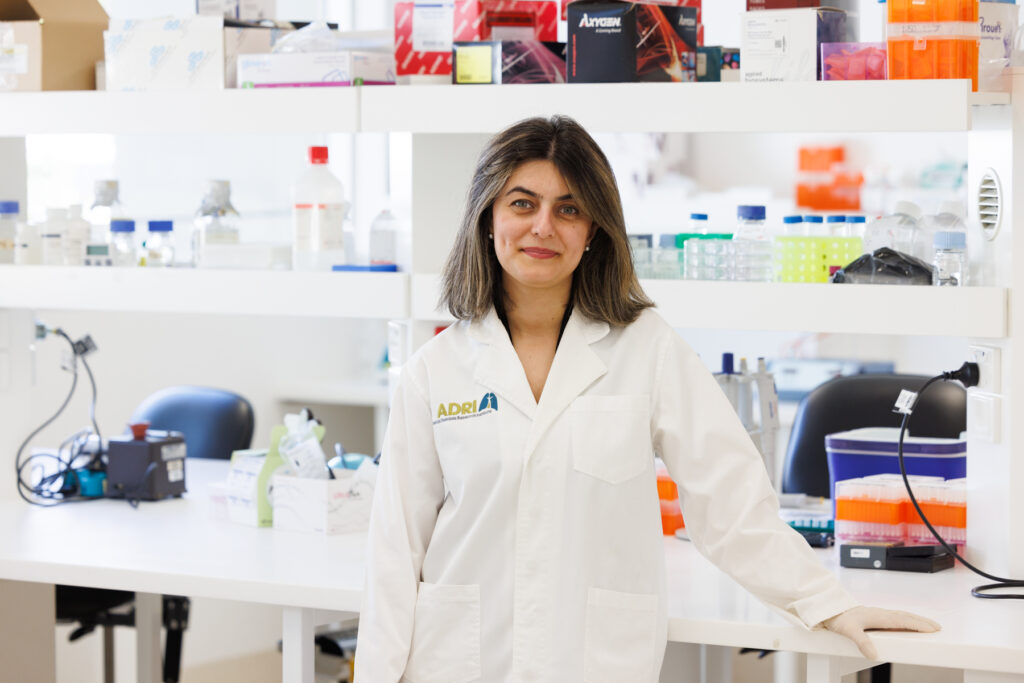
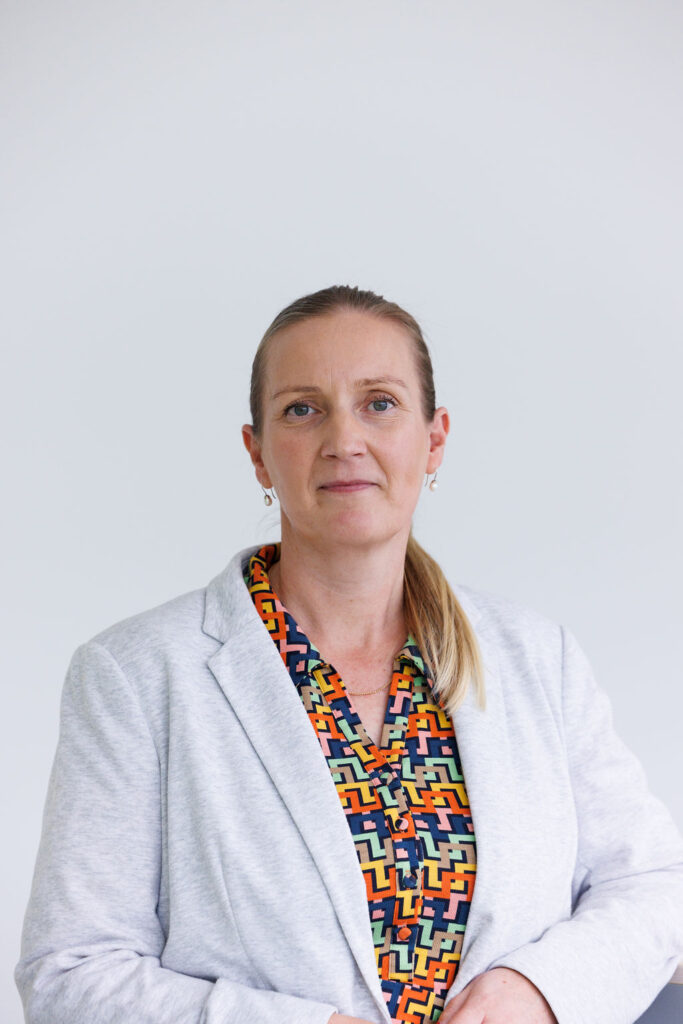
Our team
Our team of doctors, researchers, scientists, nurses and industry leaders excel in innovative thinking and strive for excellence every day.
The importance of collaboration
We are on a mission to collaborate with those working toward the elimination of asbestos and dust-related diseases.
About the Diseases
Asbestos and dust diseases remain a clear and present danger. 4,000 Australians die each year from asbestos-related diseases. It is estimated that one in four workers are at risk of silica-related disease.
What is asbestos?
Asbestos is a type of mineral made up of tiny, needle-like fibers. Known for its ability to resist heat, electricity, and corrosion, it was widely used in many construction materials. Inhalation of asbestos fibres can directly lead to disease and a form of cancer called mesothelioma.
What is Silica?
Crystalline silica is a natural mineral found in sand, stone, concrete and mortar. Found in high quantities in materials commonly used for tunnel construction and engineered stone, inhalation of silica dust particles can cause serious disease.
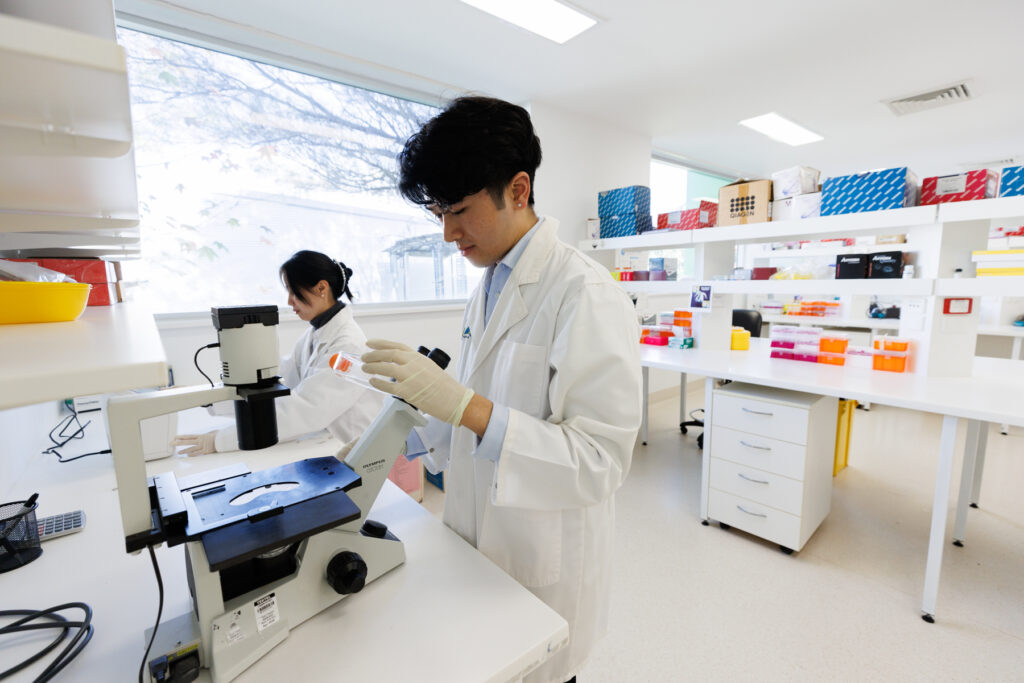
Research
We are on a mission to understand asbestos and dust-related disease development and diagnosis through dedicated research. Our evidence-led research drives advancements in medical and scientific understanding and guides our global education and training initiatives.
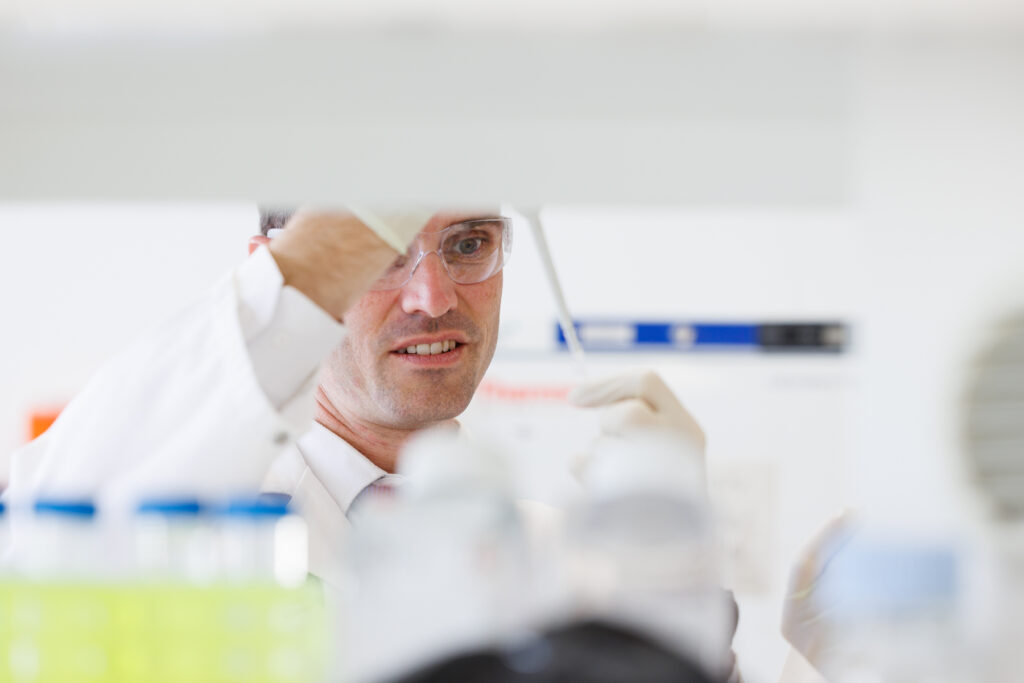
Our impact
We are unrelenting in exploring every avenue that will achieve our mission of improving patient outcomes, uncovering new treatments and ultimately ending all asbestos and dust-related diseases.
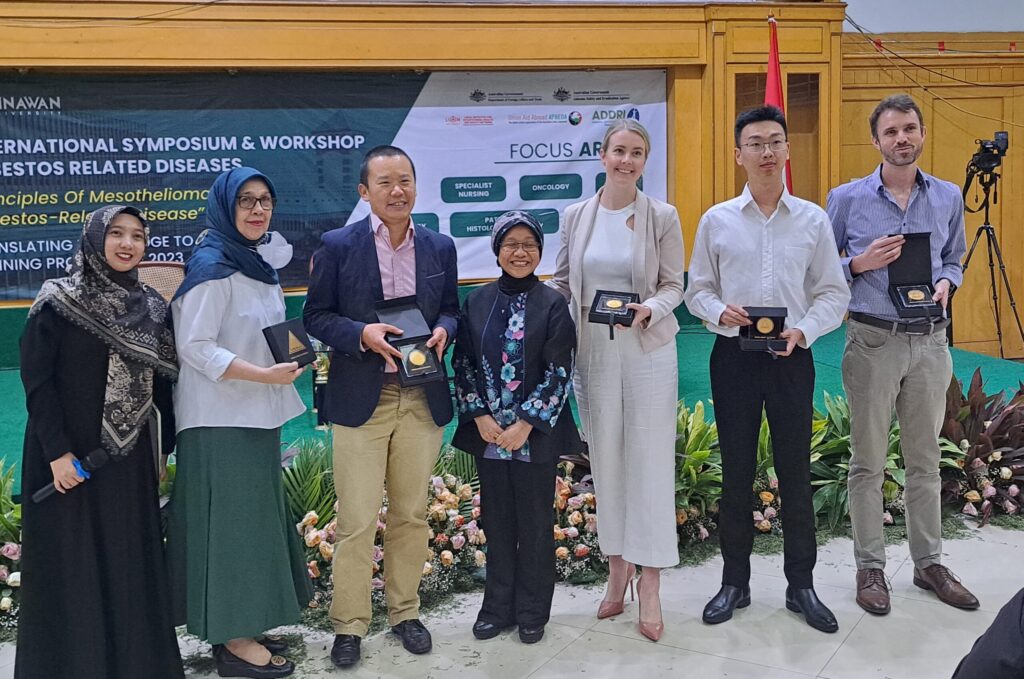
Working globally
Our status as the WHO Collaborating Centre for Elimination of Asbestos-Related Diseases ensures that our dedication, research and collaboration will have significant impact around the world.
Support
We are on a mission to support people impacted by dust-related diseases. Our Mesothelioma and Silicosis Support Service addresses the needs of patients suffering dust-related diseases and supports their families.

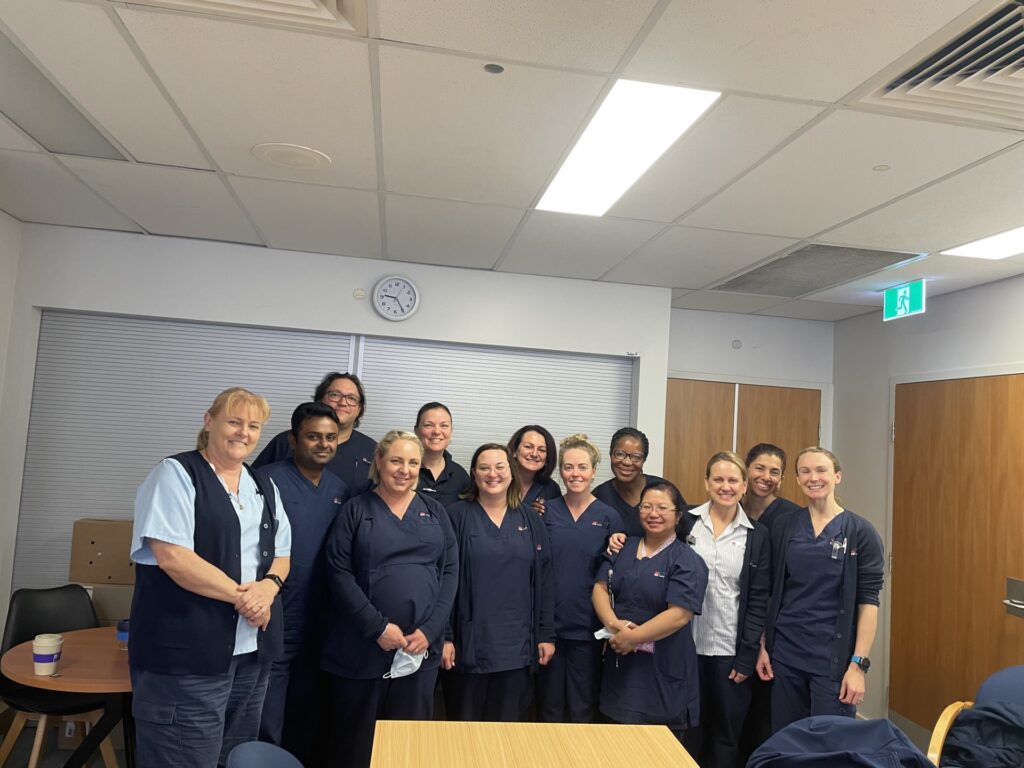
Mesothelioma support
Our specialist nurses are here to address the needs of our patients with mesothelioma and to support carers and families. We can answer any questions you may have and help you navigate the health system
Silicosis support
Emotional and practical support for individuals diagnosed with silicosis and their caregivers.
Education
We are on a mission to educate that asbestos is a very real threat to people all over the world and provide the knowledge and tools to care for those impacted.
Read more
eToolkit
An internationally recognised eToolkit on asbestos-related diseases (ARDs), important research to fill knowledge gaps on the elimination of asbestos and much needed training on ARDs in developing countries.
Mesothelioma learning module
Access online training for nurses/health care professionals to assist with diagnosing and caring for patients with mesothelioma.


")